Measuring Personal Intelligence Growth Over Time
Stop averaging your intelligence away; track fluid and crystallized growth separately.
Most of us carry a quiet assumption about intelligence: that it was more or less decided a long time ago, that a number somewhere captures it, and that the work now is just to perform consistently within whatever range we were handed. That assumption feels humble, even scientific. It is also, in important ways, wrong.
Not wrong in the dramatic, self-help sense. Wrong in a more technical, measurable sense with real consequences for how you actually observe your own cognitive development. The question worth asking is not "how smart am I?" but something more tractable: how do I know whether my cognitive capacities are developing, and in what directions?
The intuitive model most people carry comes directly from the history of psychometrics. Since the early twentieth century, researchers noticed something consistent: people who scored well on one cognitive test tended to score well on others. This positive intercorrelation across tasks suggested a common underlying factor, which Charles Spearman called g, general intelligence. The Stanford-Binet and its successors were built on this finding. A century of educational and occupational testing followed.
That model is incomplete. And what it leaves out matters enormously if you are trying to track growth rather than simply rank yourself against other people.
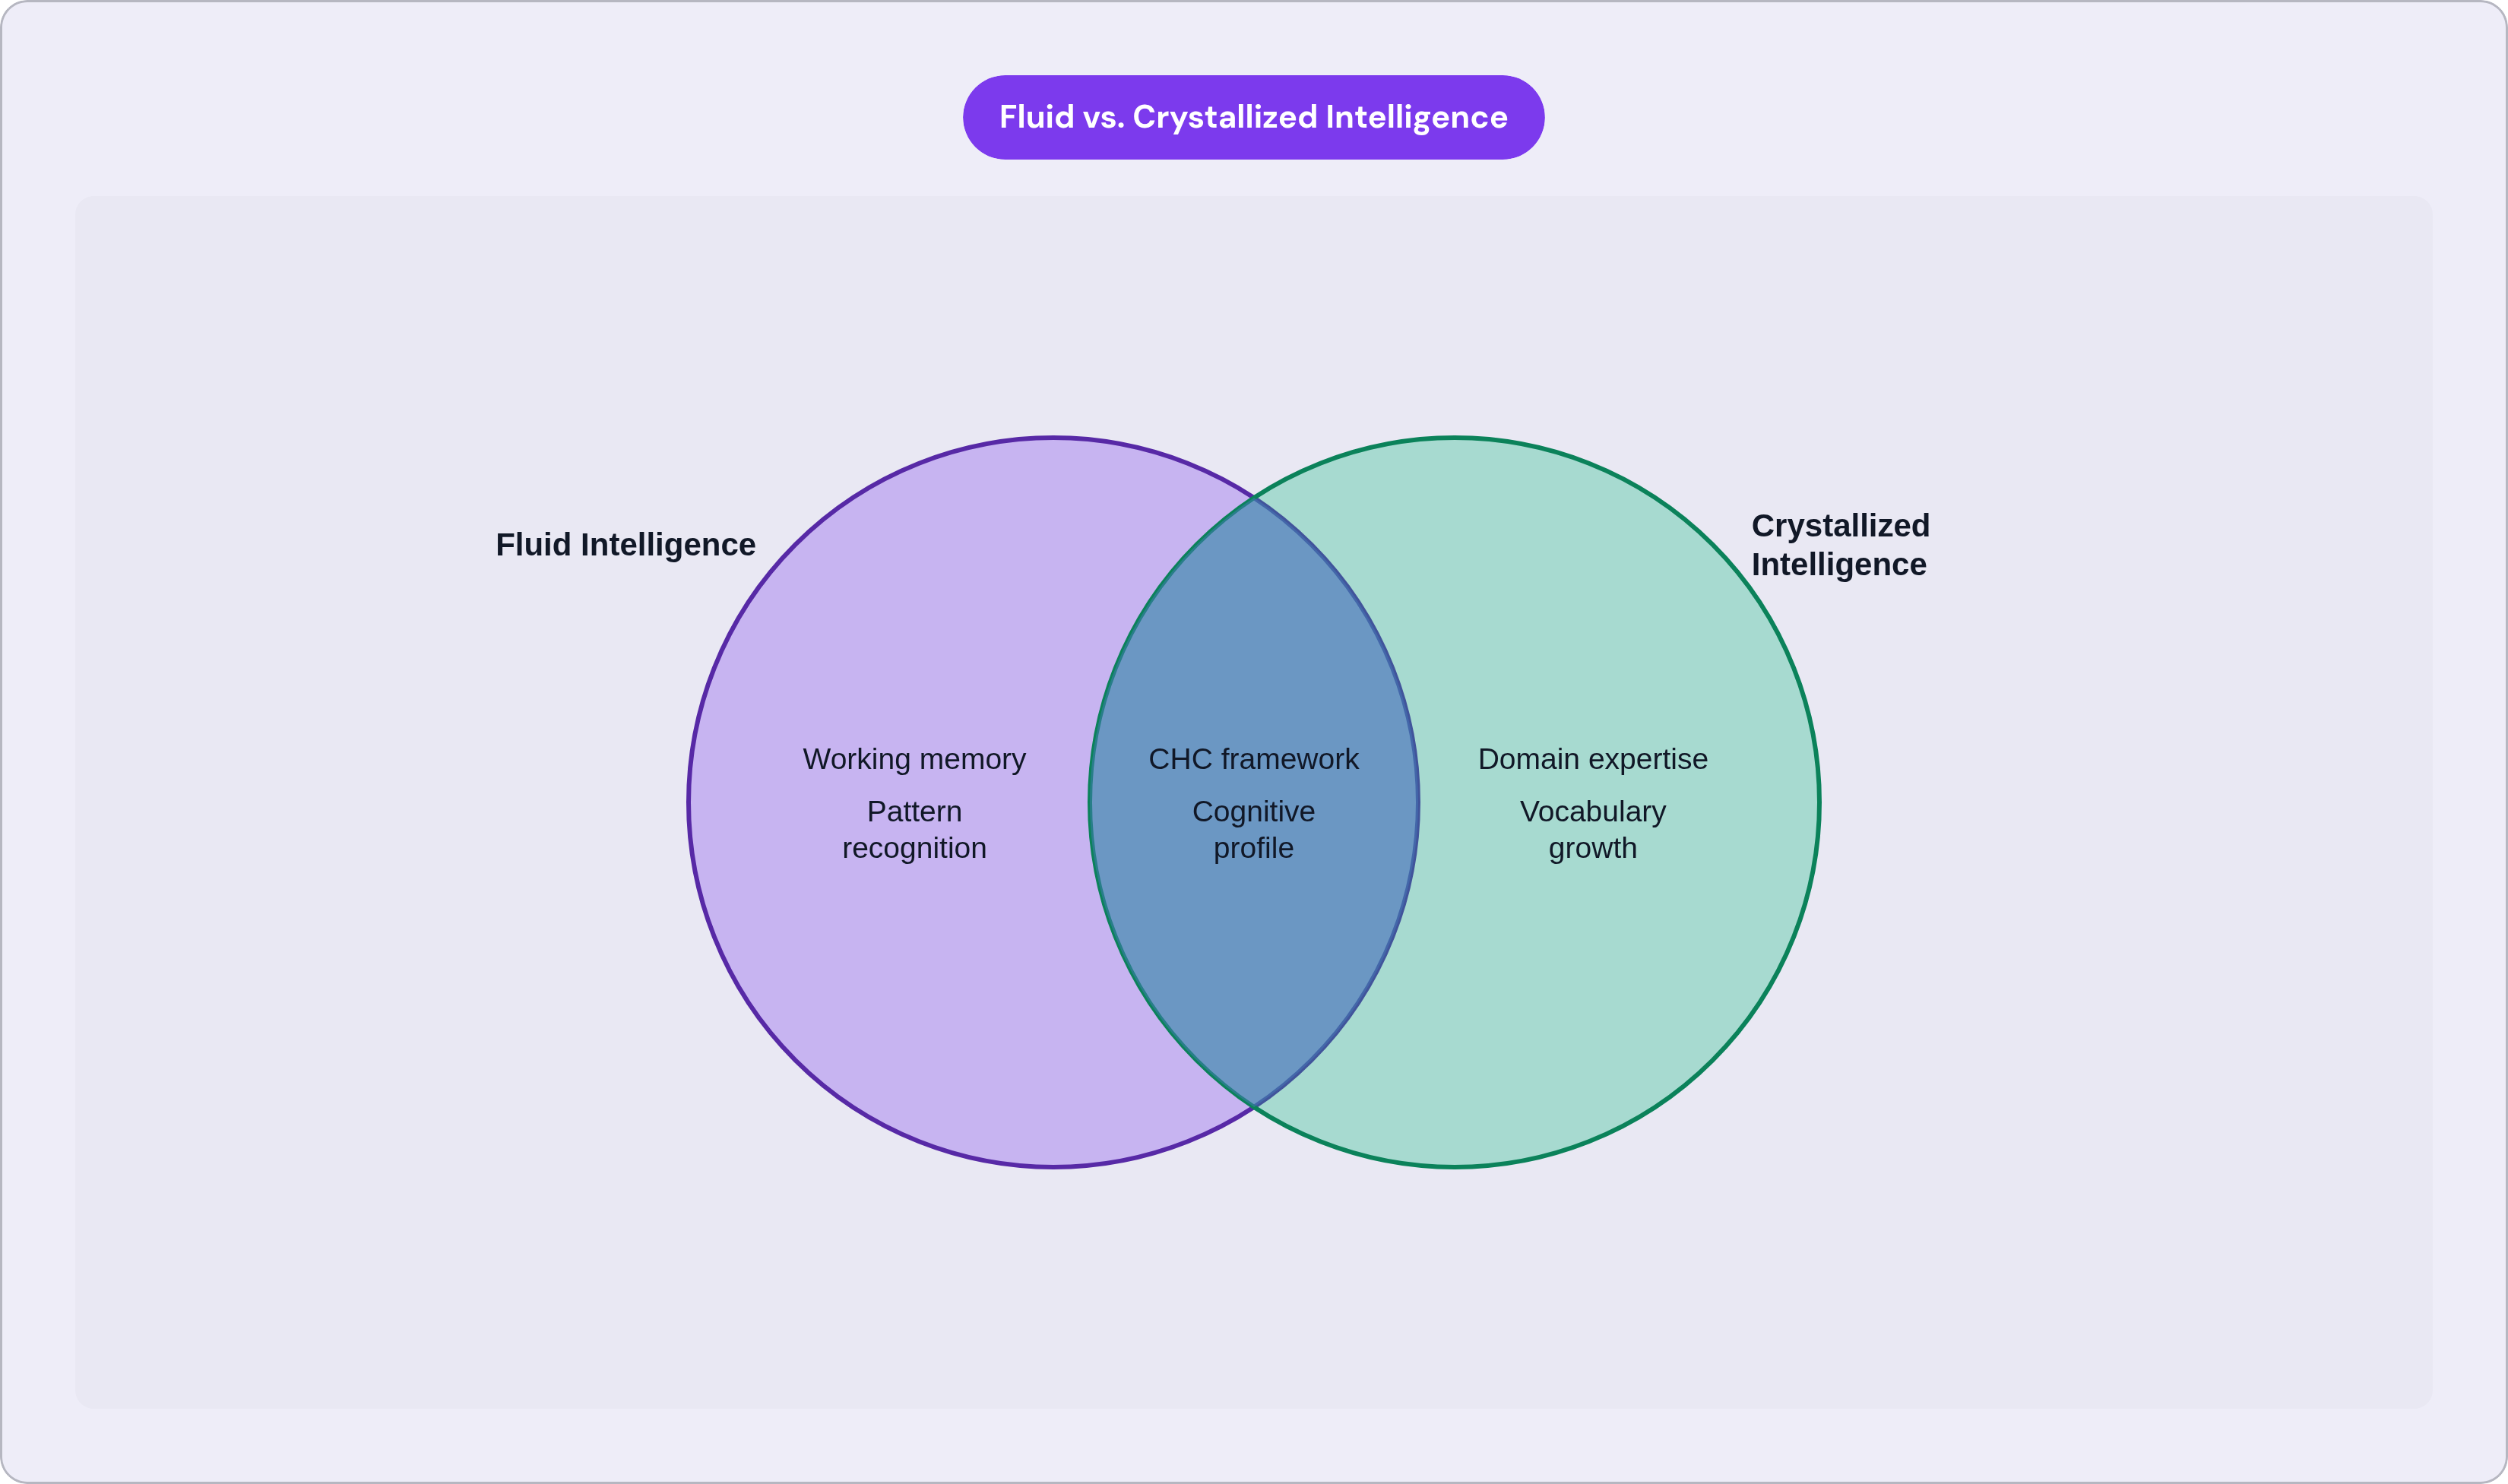
The most practically useful distinction for personal tracking comes from Raymond Cattell's later work, subsequently refined by John Horn and John Carroll into what clinicians now call the CHC framework. The key split is between fluid and crystallized intelligence. Fluid intelligence is your capacity to reason through problems you have never seen before, to hold information in working memory, to recognize patterns without a map. Crystallized intelligence is your accumulated store of knowledge, vocabulary, and domain expertise. These two dimensions have very different developmental trajectories. Fluid intelligence peaks somewhere in early adulthood and declines gradually thereafter. Crystallized intelligence keeps growing well into later adulthood.
The same person, at the same age, can be simultaneously declining on one dimension and growing on another. A composite score averages those two movements together and tells you almost nothing useful. That is not a minor technical quibble. That is the whole problem with tracking yourself by a single number.
Howard Gardner's multiple intelligences framework deserves an honest methodological note here, because it shows up constantly in self-assessment tools. When researchers have operationalized and measured Gardner's distinct intelligence categories, the scores intercorrelate. That intercorrelation is precisely the statistical pattern psychometricians point to as evidence of g. Knowing someone's linguistic intelligence substantially predicts their logical-mathematical intelligence, which is not what a theory of truly independent faculties would predict. The framework is helpful for identifying domain strengths worth developing. It is a poor substitute for psychometrically grounded assessment when you want to track real change.
Different frameworks serve different purposes. CHC for clinical precision. Fluid/crystallized for understanding your own aging trajectory. Gardner-style categories for identifying which domains to invest in. What all of them agree on: intelligence is not one thing. Measuring its growth requires tracking more than one thing.
Whether cognitive ability actually changes, and what the longitudinal evidence shows
The research here is more complicated than either the optimists or the pessimists let on.
Rank-order stability, meaning how you compare to your peers, is high and increases with age. A 2024 meta-analysis drawing on data from more than 85,000 participants across 29 countries found that this stability plateaus around age 20 and remains high through adulthood. If you were in the top third of cognitive performers as a young adult, you are likely to remain roughly there across your lifetime. That part is real.
But rank-order stability is not the same as your scores being frozen. Longitudinal studies tracking individuals over decades show that scores shift meaningfully within a lifetime. A landmark Nature study found that a substantial proportion of teenagers experienced IQ changes of ten or more points between ages 14 and 18, with some shifting by more than twenty. These were not measurement errors; they corresponded to observable changes in brain structure.
A more recent finding complicates the picture further. An analysis of IQ test data from 2005 to 2024 found that what has been declining is not scores on individual cognitive subtests, some of which actually increased, but the correlation between different cognitive abilities. People's cognitive profiles are becoming more uneven. Researchers call this "ability differentiation," and it suggests the relevant question is no longer whether someone is "smart" in aggregate but which specific capacities are moving in which direction and why.
Your position relative to others is fairly stable. But the internal composition of your cognitive profile is in motion. That is the thing worth tracking.
The biological basis for this is not speculative. The adult brain remains structurally responsive to learning and environment. Intensive learning produces measurable changes in gray matter density and white matter connectivity. The levers that influence this, identified consistently in peer-reviewed literature, include regular physical exercise, sleep quality (particularly slow-wave and REM stages, which drive memory consolidation), dietary factors, and sustained mindfulness practice. These are peripheral wellness considerations only if you ignore their upstream effects on every cognitive output you want to measure.
What makes a measurement approach suitable for tracking growth rather than just status
There is a distinction that rarely gets explained clearly, and it is foundational to everything that follows.
Assessments designed to diagnose cognitive status at a point in time require different psychometric properties than assessments designed to detect change over time. Most cognitive tests, including the ones you have probably encountered, were built for the former. Using them for the latter is like using a bathroom scale to track daily water retention: it can do it, roughly, but it was not engineered for that sensitivity.
For longitudinal tracking, four properties matter. Test-retest reliability: will you get a similar result if nothing has genuinely changed? Without strong reliability, you cannot distinguish real growth from measurement noise. Sensitivity to change: can the instrument detect the modest, real shifts that accumulate over months? This is a different requirement from detecting clinical deterioration, which is what most tools are calibrated for. Coverage of multiple cognitive domains: a single composite score averages away precisely the within-person variation you are trying to observe. And consistent testing conditions: time of day, fatigue, and distraction contaminate longitudinal comparisons if left uncontrolled.
The consumer tool landscape fails on most of these criteria. A systematic review identified over 3,000 app- and web-based cognitive self-testing tools. Only 25 met basic inclusion criteria. Only seven reported any psychometric quality data at all. Only one reported the full necessary set: norms, reliability, validity, sensitivity, and specificity.
Most cognitive apps are engagement products, not measurement instruments. They are designed to bring you back tomorrow, not to give you scientifically defensible information about whether your reasoning has actually changed.
There are exceptions. The Boston Cognitive Assessment (BOCA) was developed specifically for longitudinal, self-administered use and validated against an established clinical instrument, with a correlation of 0.80. It demonstrated strong internal consistency and a one-week test-retest reliability of 0.89. That is what a purpose-built tracking tool looks like. When evaluating anything else you consider using, ask one question: does this tool publish its psychometric properties? If the vendor does not, treat the results as approximate at best.
A practical multi-dimensional framework for observing cognitive growth
No single tool captures cognition fully. Useful tracking uses complementary instruments that together cover what any one instrument misses.
The framework I have come to find practical has three layers, and each addresses a blind spot in the others.
Layer 1: Periodic cognitive benchmarking
A validated, multi-domain assessment taken at consistent intervals, every three to six months. The goal is not the score itself. It is the score relative to your own prior scores, under consistent conditions. Administer it at the same time of day, after comparable sleep. Do not let yourself narrate away a weak result with "I was tired" unless you logged your sleep the night before and can actually support that claim.
The minimum requirement: the tool must have documented test-retest reliability. If the vendor does not publish this figure, treat the results as directional, not definitive.
Layer 2: Domain-specific skill tracking
Fluid reasoning, working memory, processing speed, and verbal knowledge tracked separately rather than collapsed into a composite. This is where the ability differentiation finding becomes actionable. Your sub-scores will diverge in ways a composite obscures. A deliberate practice log for a skill requiring novel problem-solving tracks fluid reasoning in context. Vocabulary acquisition or reading-speed records track crystallized growth. Timed reasoning exercises with logged error rates give you processing speed over time.
These do not need to be elaborate. A consistent log, maintained with the same methodology across months, is worth more than intermittent sophisticated testing.
Layer 3: Decision-quality and metacognitive journaling
Cognitive growth that matters in real life shows up in decision quality before it shows up in test scores, if it shows up there at all. A structured decision log works like this: record a significant decision, the reasoning behind it, and your predicted outcome. Revisit it later. Score the accuracy of your prediction and the quality of your reasoning in hindsight.
The metacognitive layer is equally important. What strategy did I use? Where did I get stuck? What assumptions did I fail to examine? This kind of structured self-interrogation is where growth-oriented assessment does its most durable work, building the habit of monitoring your own understanding and adjusting based on what the feedback actually says rather than what you hoped it would say.
Two things about the framework as a whole: cadence matters as much as content. Irregular, opportunistic measurement cannot detect gradual change. The framework only works if timing and conditions are held roughly constant. And when layers produce divergent signals, read that as information, not noise. If fluid benchmark scores plateau while crystallized and decision-quality scores improve, that is not failure. That is what normal adult cognitive development looks like against the fluid/crystallized arc.
How the psychological stance toward growth affects what the measurement produces
There is a finding from Carol Dweck's research that I find more useful than the growth mindset concept in its popular form.
In neuroimaging studies, people with what Dweck calls an incremental mindset showed measurably more neural engagement specifically when reviewing their errors. They were processing corrective information more deeply, at a biological level. People with a fixed mindset disengaged from error feedback. That is not a metaphor or a motivational claim. That is a measurable difference in how the brain allocates attention.
This matters directly for the framework. If you are using the decision-quality journal to construct the most flattering possible narrative of your choices before you revisit them, you are not getting the instrument's benefit. The framework only generates useful data if errors are treated as signal rather than embarrassment.
The honest account of the research, though, complicates the popular version. Two large meta-analyses found that growth mindset interventions account for only a small share of variance in academic outcomes. A national experiment with ninth-graders showed a real but modest grade improvement, concentrated among lower-achieving students in supportive environments. The effect exists. It is not transformative on its own, and anyone selling it as the central mechanism is overselling.
Mindset is a precondition for using the framework well, not a substitute for it. Willingness to look at unflattering data is table stakes. The framework is what makes the looking productive.
Where cognitive training fits into a tracking framework, and where its evidence runs thin
The finding that holds up consistently across the training literature is near-transfer: improvement on tasks similar to the trained task. Practice timed pattern recognition and you will get better at timed pattern recognition. What remains genuinely contested is far-transfer, improvement on unrelated cognitive tasks.
The dual n-back paradigm is the most studied case in working memory training. A 2008 study in PNAS by Jaeggi and colleagues claimed it improved fluid intelligence. Subsequent replication attempts produced mixed results. This does not mean the paradigm is useless. It means individual training studies should be treated as preliminary rather than settled, and the popular packaging of "brain training" has consistently outrun what the evidence actually supports.
Training appears more likely to produce meaningful gains when it is embedded within an assessment framework that provides structured feedback and tracks progress over time. Isolated brain game play without that structure produces weaker outcomes because the feedback loop that drives actual learning is absent. You are practicing, but you do not know what you are actually improving.
The practical implication for the framework: if you include cognitive training in your regimen, the benchmarking layer is what tells you whether transfer is actually occurring. Without periodic benchmark assessment under consistent conditions, you are flying blind on whether the training is doing anything beyond the trained task itself.
Physical exercise, sleep optimization, and dietary attention have a more consistent evidence base for broad cognitive benefit than most targeted training programs do. These belong in the framework as inputs to monitor alongside outputs, not as wellness afterthoughts you attend to when everything else is already handled.
Reading your own data over time, signals worth attending to and patterns worth skepticism
A few interpretive principles that come from working with longitudinal data in any form.
Regression to the mean is the most common misread. A strong performance followed by a weaker one is often not decline. It is statistical reversion. The framework needs at least three or four data points before a trend becomes meaningful. Two points is a line, not a pattern, and treating it like a pattern is how people alarm themselves unnecessarily or congratulate themselves prematurely.
What genuine growth looks like across the three layers: at the benchmark level, stable or improving domain-specific scores over six or more months under consistent conditions. At the skill-tracking level, decreasing error rates, faster pattern recognition, expanding domain knowledge as documented in deliberate practice logs. At the decision journal level, higher prediction accuracy over time, fewer reasoning errors of the same type recurring, and more explicit articulation of uncertainty before a decision is made rather than after.
Divergence across layers carries information. Declining fluid benchmarks alongside improving decision quality reflects the normal aging arc combined with accumulated expertise. Not a problem; a pattern worth naming explicitly so you are not misreading it as failure. Declining performance across all three layers simultaneously, particularly when accompanied by sleep disruption or mood changes, warrants clinical attention rather than more self-tracking.
One direction in measurement worth noting, though not yet practical for most readers: recent research found that adding neural efficiency measures alongside standard behavioral tests improved prediction of real-world cognitive performance meaningfully. Behavioral tests alone have ceiling effects. Self-assessment has inherent blind spots. Both of those limitations are real.
Which brings me to the honest limit of the framework. Validated self-administered tools are a reasonable starting point. But a baseline clinical assessment, a WAIS-IV or equivalent, at least once provides an external anchor that self-administered tools can be calibrated against. Self-tracking without any external reference is like grading your own essays without ever having read anyone else's work: you can detect change, but you have no reliable sense of the scale.
The long-term value is not any single data point. It is the accumulated record. A log of cognitive inputs, outputs, and decisions over years is qualitatively different information from any snapshot, because it is the only way to see whether the patterns of thinking that actually matter to you are moving in the direction you intend.